Making Sense of December Analytics Data
At this time of year we can separate clients into two distinct categories: those who cleaned up during December (eCommerce websites) and those who didn't. As a result when it comes to reporting on traffic, revenue, enquiries and other conversion points for December, the data can make for disappointing viewing for any site that hasn't been busy peddling gear that made it onto Christmas wishlists across the country.
But of course it isn't just those selling gift friendly wares who can enjoy December. Many service industry businesses will still enjoy decent levels of traffic for the month, particularly those with offerings suited to the Winter months: boiler repair, insurance, car servicing etc.
 Image Source: Pixabay
The December SEO Bombshell
The sites that really miss out once December rolls around are those operating in the business to business (B2B) space. Not only does December have fewer working days than most other months of the year, but there's a distinct lack of business activity beyond the bare minimum going on in that vague window that sits between Boxing Day and New Year's Day. If your business needs to order stationery, upgrade its IT infrastructure or hire new staff, it's not going to be doing so when half the country is AFK.
Consequently if you're doing a month on month comparison between November and December's traffic to your site, chances are that the December figures just aren't going to stack up to the months preceding it. You could put an asterisk to the side and plead "but y'know, it's Christmas" or you could throw the rulebook out the window and try making a more useful assessment by going off piste with your analytical analysis.
Working With, Not Against, Google Analytics
If we consider December versus October of 2014 we've got 21 working days compared with 23, so already December is coming up short. If you then take out the three days at the end of the month where many businesses routinely shutdown completely, or at the least operate with only a skeleton staff, you're looking at a month missing five whole days, which is an entire working week. Take a full week out of any period of statistical analysis and you're going to see numbers drop, it's inevitable.
If you take a look at the following graph from Google Analytics showing a typical month on month traffic comparison of December against November for a B2B site, it's quite clear where Christmas has come along and spoiled the party. Where at its peak this site has been receiving near on 1,000 sessions in a day, come Jesus' birthday that figure has plummeted by 98% (from 962 to 24, if you're interested).
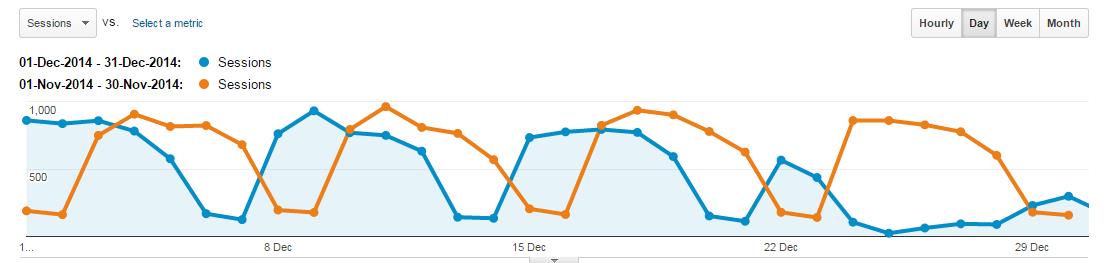
Overall traffic appears to be down by approximately 19% month on month, and nobody likes to see that, so why would you report on that? You know the end of December is going to be a real dead period for traffic, so let's take an alternative comparison instead, to get some more useful insight.
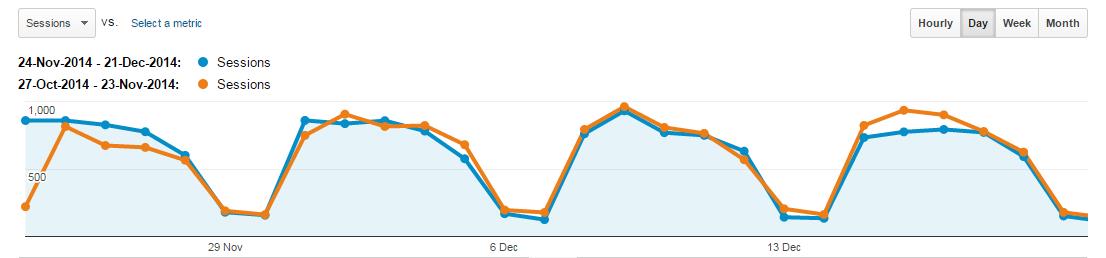
In the example below I've compared traffic for the same site across two consecutive four week periods containing 20 working days each, up to 21st December (the end of the week before Christmas). Lo and behold we're presented with a far more pleasing graph, both in terms of the figures and for its delightful visual symmetry, satisfying my OCD demanding order from chaos.
Using Common Sense With Your SEO Traffic Reporting
If what you want to report on is progress then this neat little package does just that. There's evidence of an improvement over time, it's just not calendar month on calendar month. When the volume of traffic to your website is so weekday dependent, it makes sense that you'd compare like for like periods of working days rather than picking out the month on month data which can be skewed massively simply by virtue of how the calendar fits around this particular year.
And it's not just the annual season of goodwill that comes round to interfere with our analytics, because any site that depends upon the majority of its traffic coming from business users during the working week is going to be subject to seasonal fluctuations if you measure traffic on a calendar month by calendar month basis. Another good example of this comes courtesy of November 2014, when compared with its preceding month October.
October 2014, as I pointed out earlier, contained a total of 23 working days, however November 2014 was caught short with just 20 working days. That's 13% less working day traffic to report on, and I've not even highlighted that Thanksgiving on 27th November counted as one of America's rare public holidays, meaning that if you're reliant upon business traffic from the States then November 2014 was a brutal month, shorn of four valuable working days that October before it had boasted.
It's another prime candidate month for reorganising how you report on the figures. The example below shows a US focused B2B website's sessions comparing November to October:
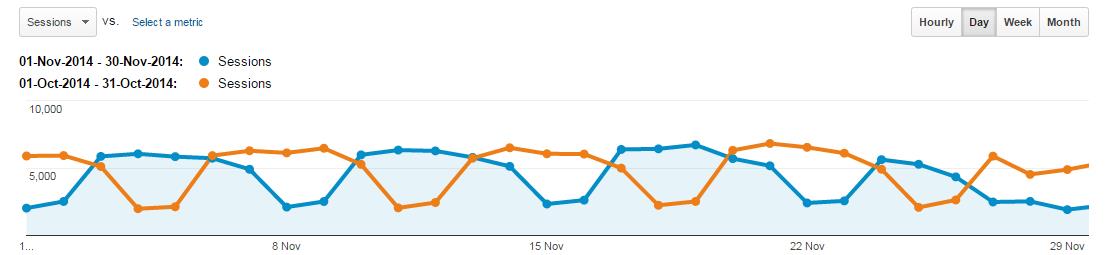
Note how November's traffic tails off significantly at the end of the month. Thanksgiving in 2014 fell on a Thursday and evidence suggests that a lot of US folk took the executive decision to take Friday off too, as Friday's traffic is as low as the site's regular weekend traffic, less than half that of the previous Friday.
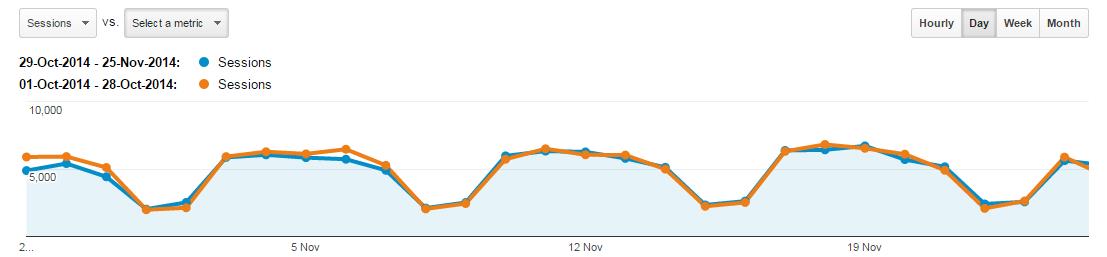
Removing Thanksgiving from the equation and reporting instead on the four weeks leading up to the day preceding Thanksgiving, compared with the four weeks immediately prior to that, we once again find an altogether more aesthetically gratifying picture:
Don’t Manipulate Data, Just Use The Useful Bits
Of course you can't always pick and choose what you'd like to report on and often a calendar month on calendar month comparison is the standard benchmark by which businesses expect to be measured. But this doesn't mean you can't go the extra mile and highlight both sides of the story. "Yes, month on month figures look disappointing, but have you taken a look at these more accurate like for like figures containing more comparable data?"
Whilst most eCommerce SEO friendly websites will be slapping their thighs with glee at the month on month figures showing December vs November, for everyone else there's a reason to take a step back and look just that little bit deeper for your insight. After all, this complicated game of zen archery we call SEO is far from black and white, so ultimately you shouldn't be playing the game painting by numbers.
Follow my contributions to the blog to find out more about eCommerce, Google Analytics and great content, or sign up to the ThoughtShift Guest List, our monthly email, to keep up-to-date on all our blogposts, guides and events.